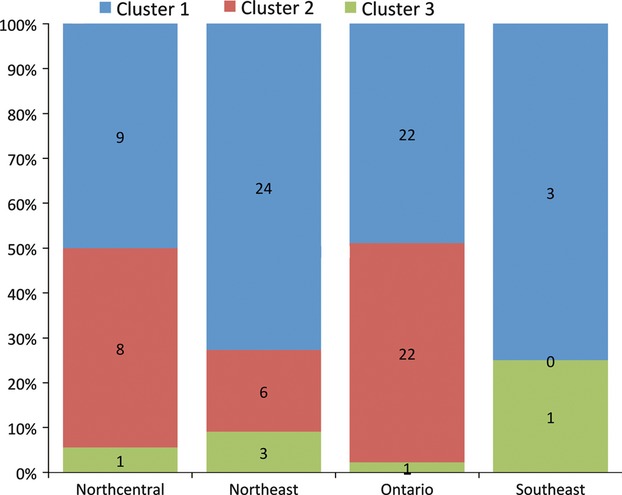
Figure 7.

Frequency of isolates from each of the three genetic clusters, determined by assignment tests in the program Structure and PCA analysis, for each region in North America where Oc-j was collected. Numbers in each segment represent the number of isolates in each cluster in each region.
