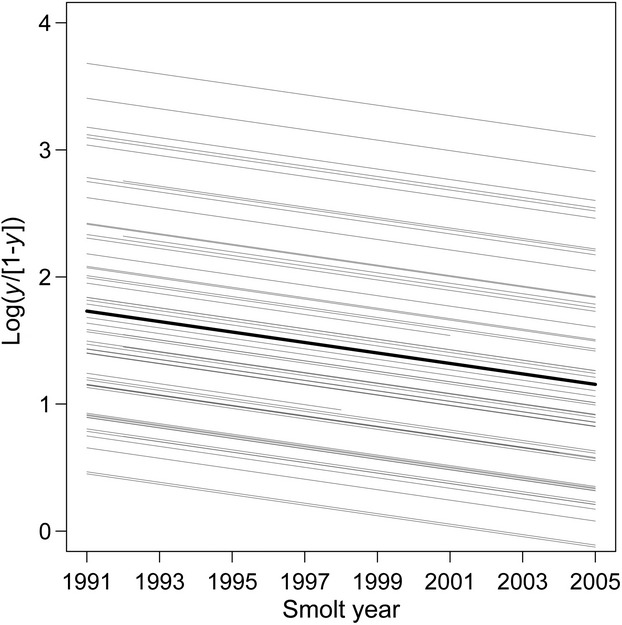
Figure 1.

Predicted values obtained by fitting a random intercept model to the proportions’ time series. The black line represents the fitted values for the population of rivers and is specified by the following equation  where both coefficients are statistically significant (P < 0.0001). Whereas the gray lines represent the within-group fitted curves (see further details in Fig. S2).
