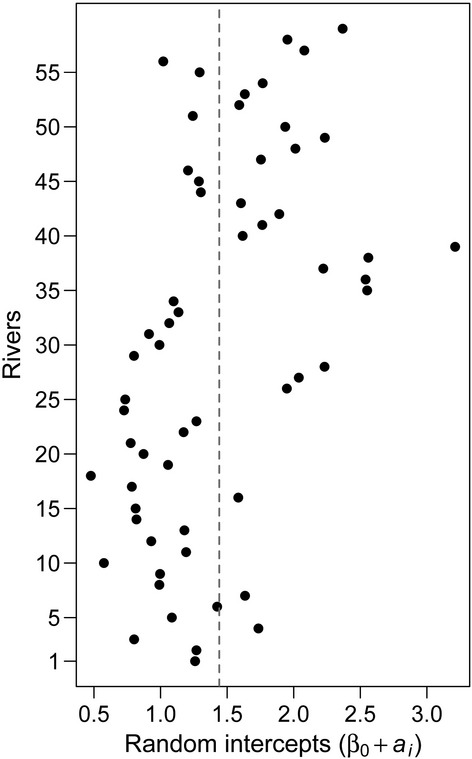
Figure 4.

Estimated random intercepts for rivers. River-specific intercepts (β0 + ai) representing the predicted logit-transformed 1SW fish proportion at a value of zero of the PC1 of SST in September and at the ln-mean value of discharge. The gray dashed line represents β0 (Table 1). The rivers are numbered chronologically along the Norwegian coast from south to north. See Table S1 for rivers’ numbers.
