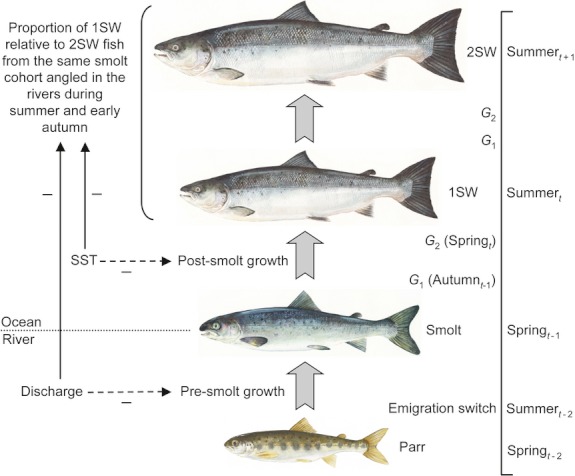
Figure 5.

Schematic representation of the Atlantic salmon life cycle and the relationships reported in this study. Fish mature after one-sea-winter (1SW) or two-sea-winters (2SW) depending on the route determined by the responses to the developmental switches G1 and G2 (see Mangel and Satterthwaite 2008). Black arrows indicate the (negative) relationships modeled in this work, whereas dashed arrows show the hypothetical (negative) effects of sea surface temperature (SST) and discharge on post- and presmolt growth, respectively. See the main text for further discussion on the potential nature of the relationships involved. The modeling framework by Thorpe et al. (1998) inspired this sketch. Drawings credits: © Atlantic Salmon Federation (http://www.asf.ca)/J.O. Pennanen.
