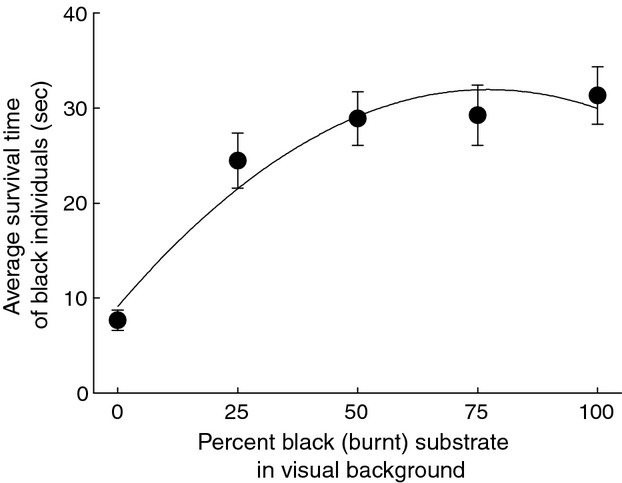
Figure 2.

Estimated survival times for images of black Tetrix subulata pygmy grasshoppers presented on a computer screen to human predators against images of natural backgrounds containing substrate that had been blackened by fire to different degrees (0%, 25%, 50%, 75%, or 100%). Figure shows mean (±SE) of 15 separate estimates of average survival time for each of the five background levels. The curved line denotes the fitted second order regression line. Prey images were presented for a maximum of 60 sec and survival times were estimated using LIFETEST analysis in SAS. Note that mean survival times are sometimes underestimated because if the largest observation is censored the estimation is restricted to the largest event time. See text for details.
