Figure 5.

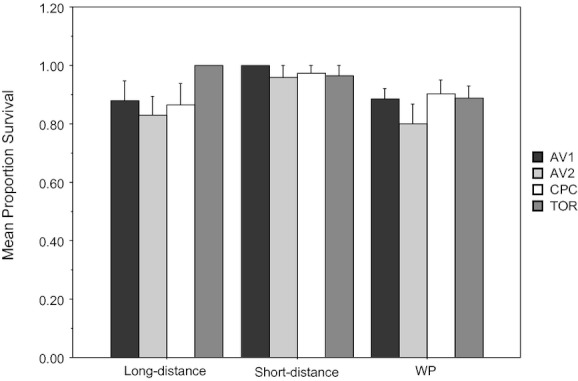
Average survival of seedlings among the three experimental cross distances for each maternal population included in the pollination study. Error bars indicate ±1 standard errors.

Average survival of seedlings among the three experimental cross distances for each maternal population included in the pollination study. Error bars indicate ±1 standard errors.