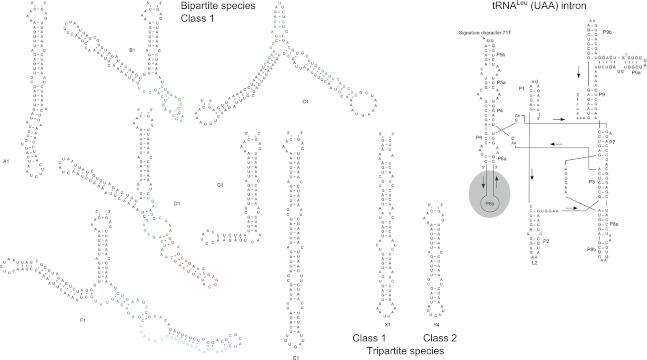
Figure 5.
Two-dimensional model of the tRNALeu (UAA) intron secondary structure (Cech et al. 1994) and predictions of the secondary folding structures of the variable P6b stem loop for selected genotypes from bi- and tripartite species (Zadeh et al. 2011), illustrating differences in the Nostoc genotypes. Colored base pairs in the genotypes B1, C1, D1, and F1 show the position of major indels. Gray colored parts in the intron show variable nucleotide positions.

