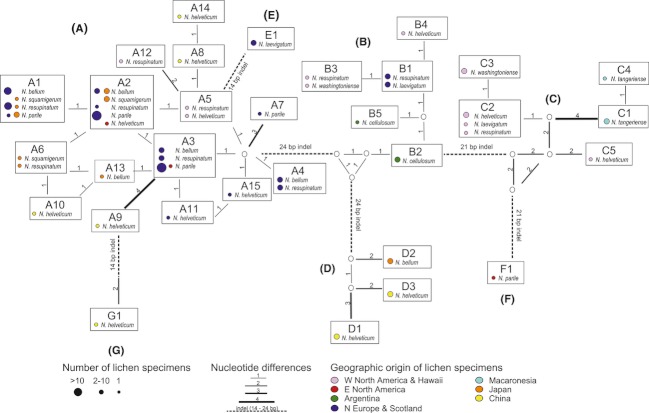
Figure 6.
Haplotype network of Nostoc photobionts of bipartite Nephroma species from different geographic regions. The network was inferred from complete tRNALeu (UAA) sequences (285–365 nucleotides). The Nostoc genotypes are organized into subgroups (A–G), corresponding to the presence of major indels. Numbers by the connecting lines quantify the differences between the most similar genotypes. Major indels are shown as dashed lines.

