Figure 4.

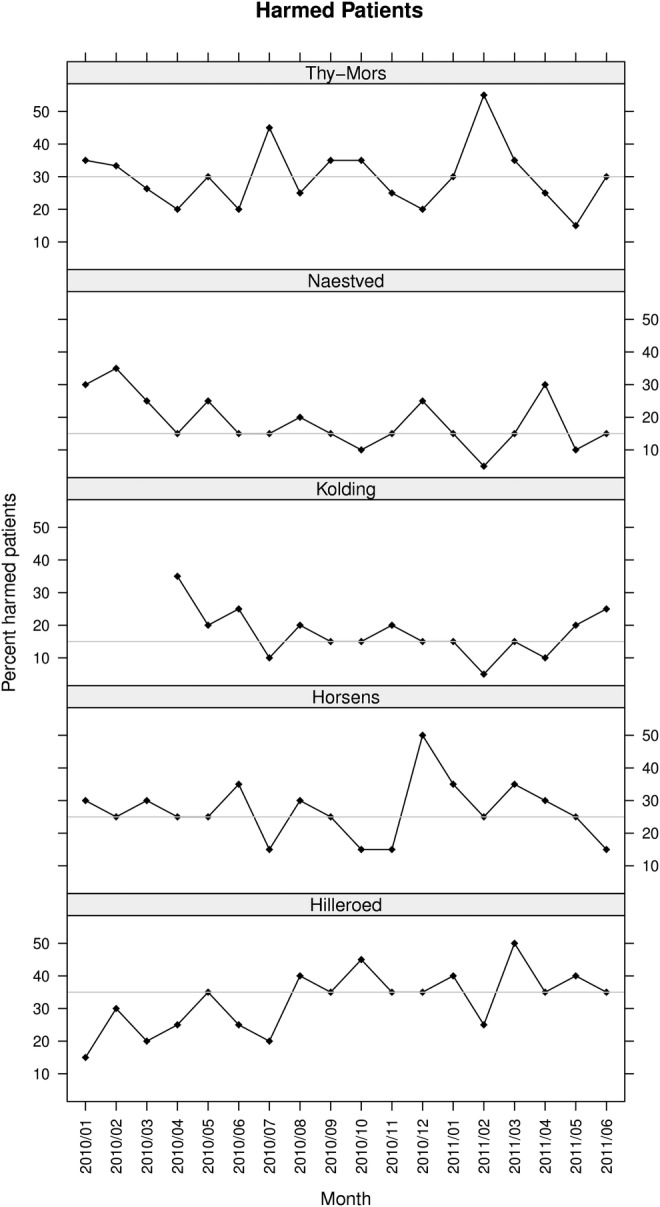
Harmed patients. The run charts show the percentages of harmed patients measured with the global trigger tool. The horizontal line is the median percentage of harms.

Harmed patients. The run charts show the percentages of harmed patients measured with the global trigger tool. The horizontal line is the median percentage of harms.