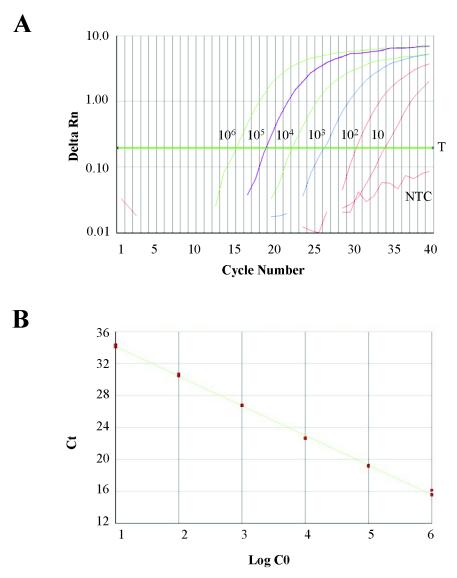
FIG. 2.
Example of standard curve with plasmid containing ITS1-5.8S-ITS2 rDNA sequence of A. minutum. (A) Amplification plot for standard curve with plasmid copy number from 106 to 10. The cycle number is plotted versus the Delta Rn. The Delta Rn represents the Rn minus the baseline signal established in the early PCR cycles. Three replicates were performed for each reference DNA sample, but data for only one are shown here. (B) Calibration curve plotting log starting copy number (C0) versus Ct. Slope, −3.71; correlation coefficient (R2), 0.9986. NTC, no-template control; T, threshold.

