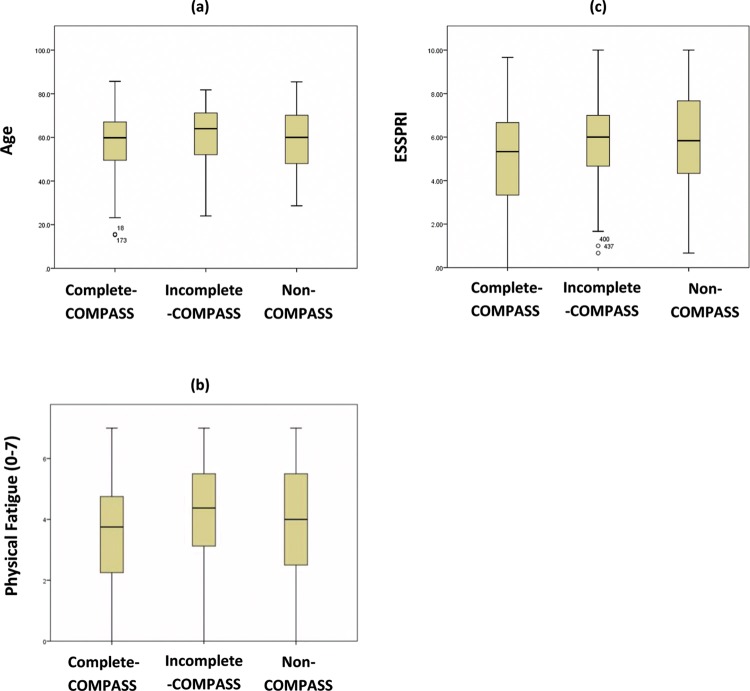
Figure 1.
Box plots showing the median, interquartile ranges, extreme ranges and extreme values for (A) age, (B) physical fatigue and (C) ESSPRI of the complete-COMPASS group and the remaining groups of the cohort. COMPASS, Composite Autonomic Symptom Scale; ESSPRI, EULAR Sjögren's Syndrome Patient Reported Index.

