
Fig. 2.
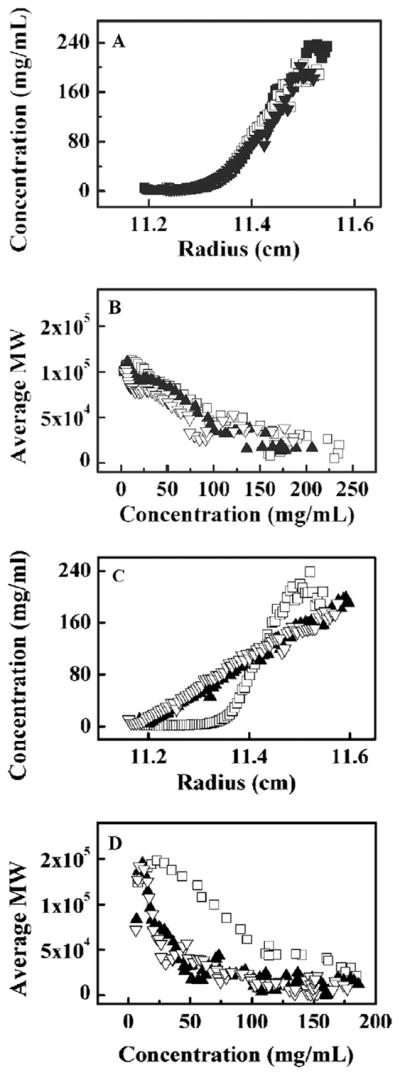
Equilibrium gradients and concentration dependence of apparent molar mass of three monoclonal antibodies in moderate ionic strength buffers (panels A, B), and in low ionic strength buffers (panels C, D). The symbols correspond to the experimental data. The loading concentration of all three antibodies was 100 mg/ml in both sets of experiments. Figures adapted from Ref.[34].