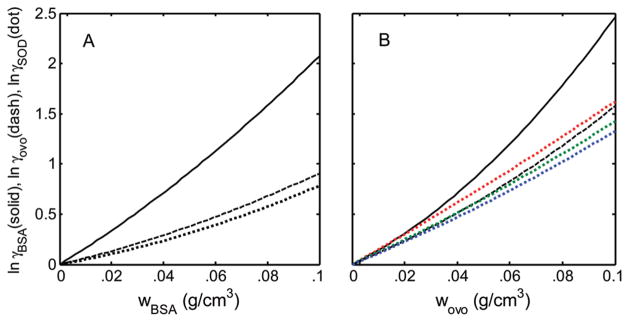
Figure 3.
Calculated dependence of of tracer proteins upon the concentration of crowder proteins. All curves were calculated using eq 7 with the appropriate best-fit values of the corresponding virial coefficients given in Tables 1–3. Tracer species are BSA (solid curves), ovomucoid (dashed curves), and SOD (dotted curves). Results obtained for tracer SOD in ovomucoid at 37, 25, and 5 °Care plotted in red, green, and blue, respectively.

