
Figure 4.
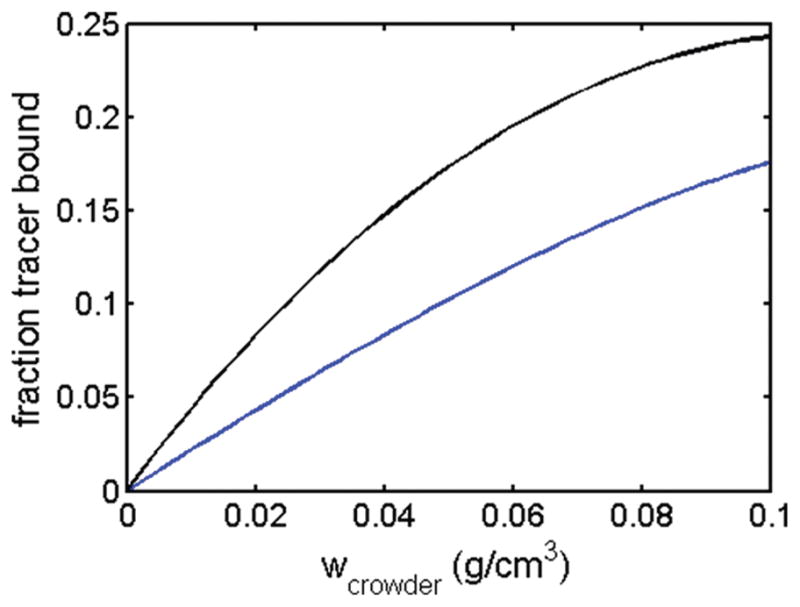
Fraction of tracer bound to crowder in mixtures of ovomucoid and BSA as a function of crowder concentration, calculated using best-fit parameters for effective HS model 3 presented in Table 1. Blue curve, trace BSA in ovomucoid crowder. Black curve, trace ovomucoid in BSA crowder.