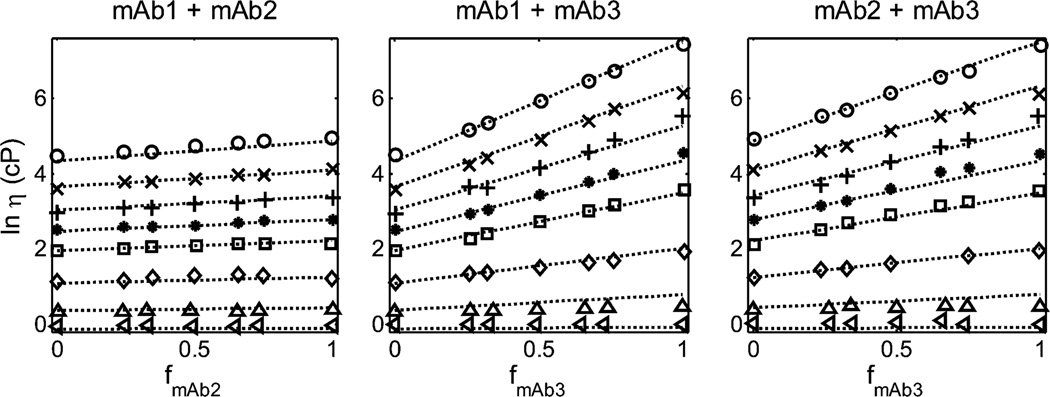
Figure 1.
Dependence of the logarithm of solution viscosity (cP) of binary mixtures of mAb1 + mAb2 (left panel), mAb1 + mAb3 (center panel), and mAb2 + mAb3 (right panel), measured in 20 mM histidine chloride buffer (pH5.0) containing 200 mM arginine chloride. Symbols: data of GLM obtained at total protein concentration of 7 (left-pointing triangles), 50 (upright triangles), 100 (diamonds), 150 (squares), 175 (asterisks), 200 (plus signs), 225 (times signs), and 250 g/L (circles). Plotted functions: best-fits of eq 3 to each data set, globally calculated using the best-fit parameter values given in Table 1.

