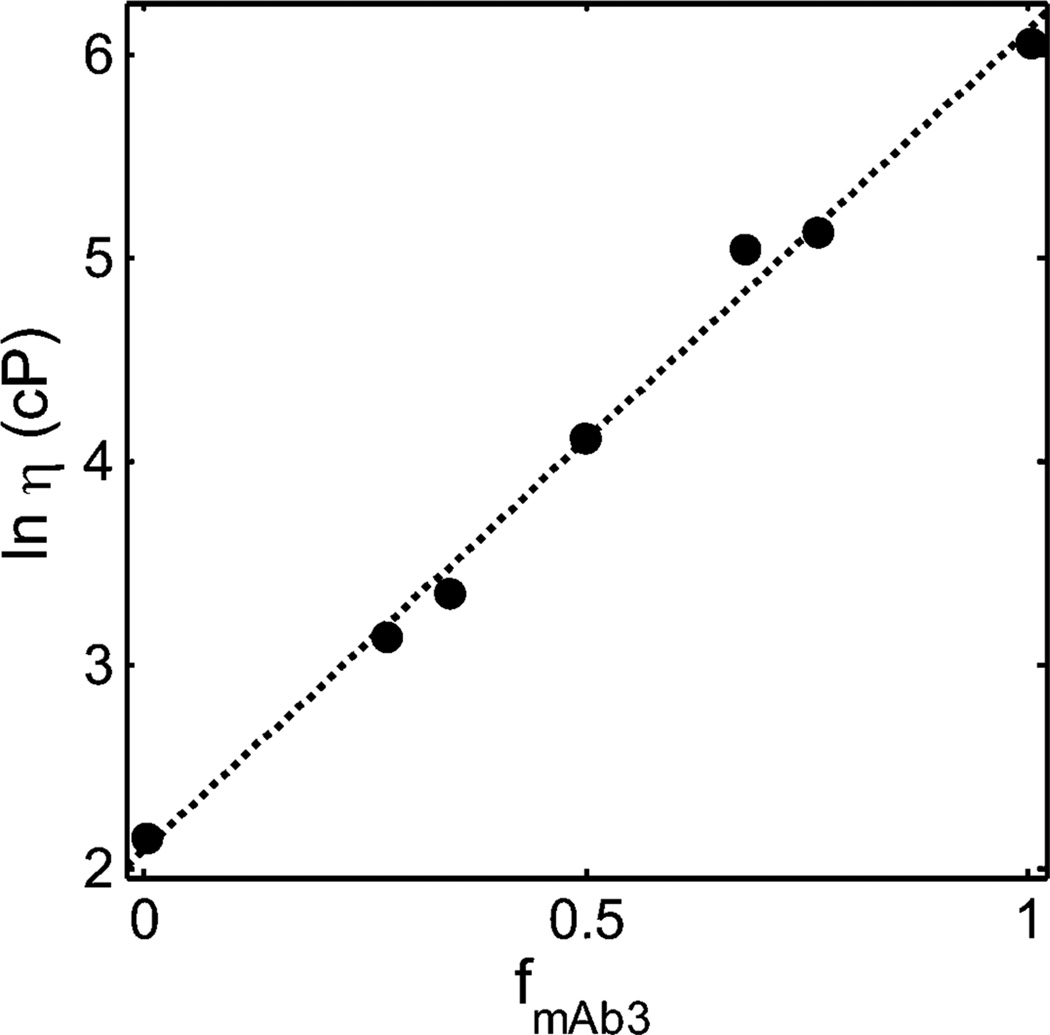
Figure 2.
Dependence of the logarithm of solution viscosity (cP) of binary mixtures of BSA + mAb3 upon weight fraction of mAb3, at a total protein concentration of 225 mg/mL. Symbols: data of GLM. Plotted function: best fit of eq 3, calculated using the best-fit values of ln ηo and w*tot given in Table 1, and the best-fit values [ηBSA] and [ηmAb3] given in Table 2.

