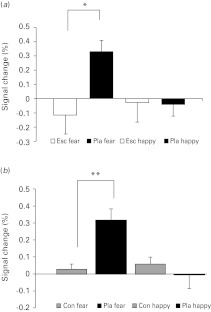
Fig. 2.
Plot depicting BOLD activation (expressed as % signal change) to fearful and happy facial expressions in right amygdala for (a) escitalopram- (Esc) and placebo-treated (Pla) participants, * p = 0.009 and (b) for healthy controls (Con) and Pla participants, ** p = 0.001. Bars show mean, error bars standard error.

