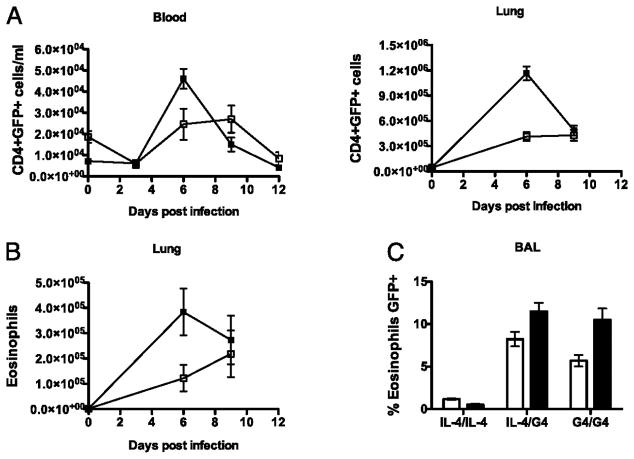
Figure 5. The timing and magnitude of CD4 T cells and eosinophil induction in response to primary and secondary Nb infection.
The total number of GFP expressing CD4+ T cells (A) and GFPexpressing eosinophils (B) were measured in the blood and lung of G4/G4 mice at various time points after primary (clear) and secondary (black) Nb infections. (C) Proportion of GFP expressing eosinophils in BAL at the peak of primary (day 9, clear) and secondary (day 6, black) responses. Blood, Lung and BAL fluid was collected and expression of CD4 and GFP by SSCHi and SSCLo cells was examined. SSCHi cells had previously been identified as >95% eosinophils following fluorescence assisted cell sorting and identification by Difquick staining according to using standard morphological and cytochemical criteria. Data points shown indicate mean ± SE from three individual animals from two experiments.

