
Figure 7. Basophil and the initiation of type 2 immune responses.
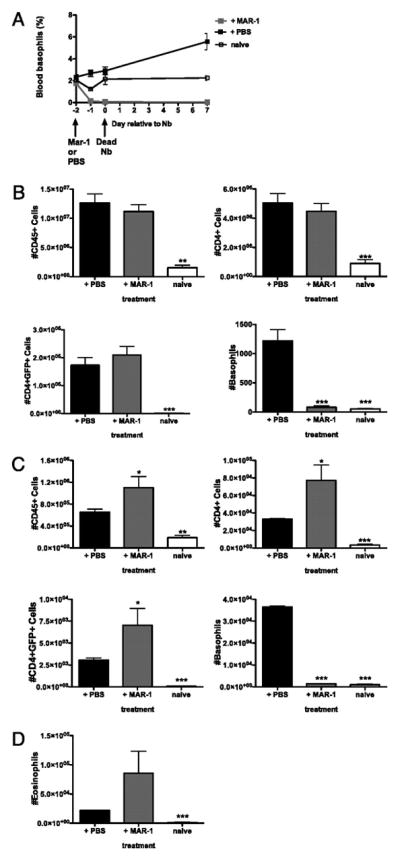
IL-4/G4 animals were administered either MAR-1 or PBS via iv injection 48 hours prior to intra-dermal infection with 600 dead N. brasiliensis. (A) Time course of basophils present in the blood as a percentage of CD45+ cells present. Total numbers of CD45+, CD4+ and CD4+GFP+ cells present were determined by flow cytometry in the draining lymph node (B) and ear (C) at 7 days post infection. (D) Total number of GFP+ eosinophils present in ear dermis. Data points shown indicate mean ± SE from three individual animals from two experiments. ***, P ≤ 0.0001; **, P ≤ 0.001; *, P ≤ 0.01; no asterisk, P > 0.05, relative to infection +PBS with Student’s t-test.