
FIG. 5.
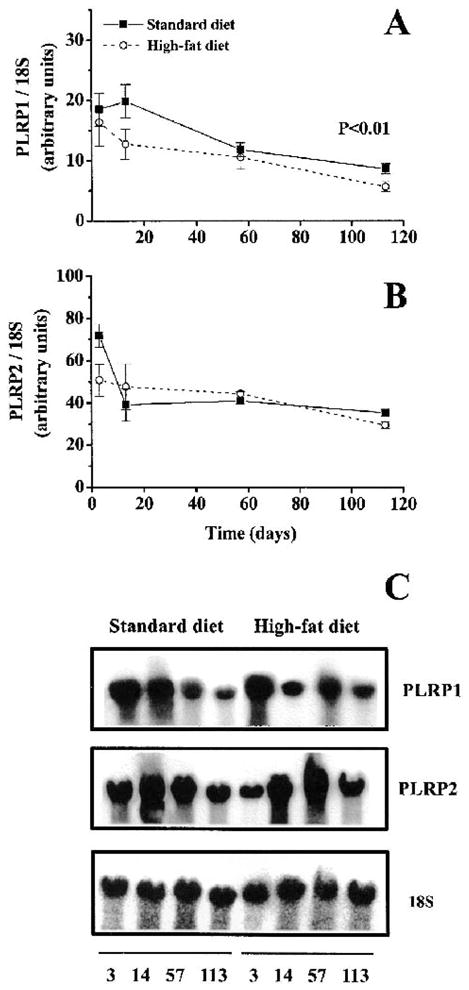
Expression of PLRP1 (A) and PLRP2 (B) mRNA in response to long-term high-fat feeding and a representative Northern blot (C). Total RNA was analyzed on Northern-blot and hybridized with probes for PLRP1 and PLRP2. Values are expressed as arbitrary units in relation to 18S rRNA. A: A significant decrease in PLRP1 mRNA expression was observed after high-fat feeding (two-way ANOVA, p < 0.01). B: There was no significant difference in PLRP2 mRNA expression between high-fat–fed or standard-fed mice. Values are expressed as means ± SEM (n = 6).