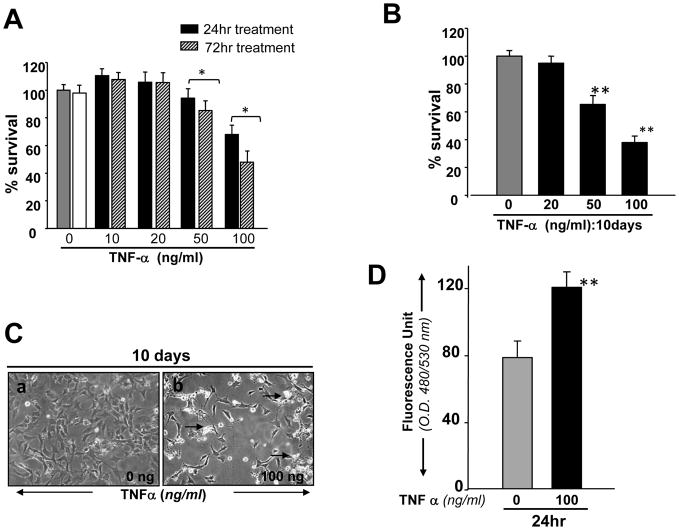
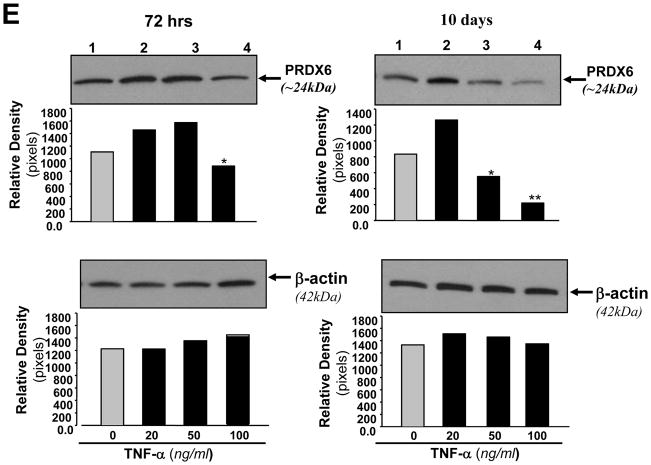
Figure 4.
(A and B) Concentration and time–dependent effect of TNF-α on viability of RGC-5. Cells were cultured with or without TNF-α at different concentrations for variable time periods, and cell viability was assessed by MTS assay. RGCs were treated with different concentrations of TNF-α for 24hr (A, black bar), 72hr (A, stripped bar) and for 10 days (Fig, 4 B: black bar). (C) Cells were culture and exposed to TNF-α for 10 days. Cells were photomicrographed and (C, a and b) are representative of the experiment. (D) Histogram showing effect of TNF-α on the expression of intracellular ROS in RGCs, Cells were treated with TNF-α (100ng/ml) for 24 hr and ROS were measured with H2-DCFH-DA dye. OD, optical dencity. Results are means ± SD of 3 experiments. *p<0.05, **p <0.001 vs. control. (E) Western analysis showing modulation of PRDX6 protein expression in RGCs treated with different concentrations of TNF-α for variable time periods. Cells were treated with different concentrations of TNF-α for 24, 48, 72hr and 10 days. Cell extracts were prepared and Western analysis was carried out as described in Experimental Methods. Upper, left panel (72 hr): Lane 1, untreated control; Lane2, 20ng/ml; lane3, 50ng/ml; Lane 4, 100ng/ml. Upper, right panel (10 days): The same concentrations of TNF-α were used as described in upper left panel (72hr). Results are derived from 3 different cell preparations. No change was observed in β-actin expression level (lower left and lower right panels; β-actin band and black bars), suggesting that modulation in expression of PRDX6 level is specific. Histograms show relative density of protein bands. *p<0.05 and **P<0.001.


