
FIGURE 1.
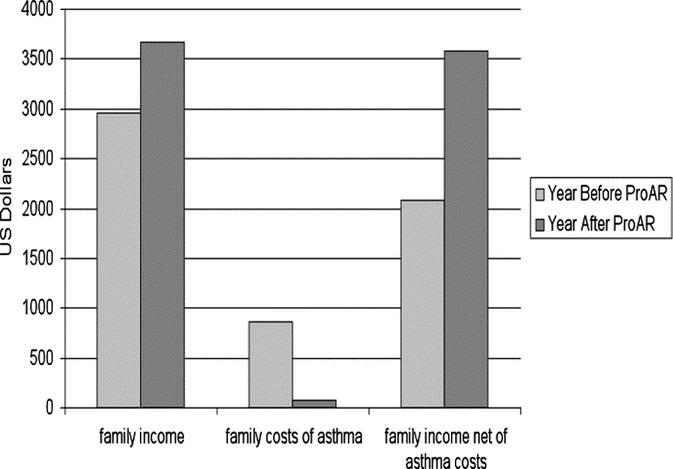
Family income, family direct and indirect cost per patient/year due to severe asthma and family annual net income, before and after ProAR intervention (median ± quartiles). Reprinted with permission from Allergy.40.
Official websites use .gov
A
.gov website belongs to an official
government organization in the United States.
Secure .gov websites use HTTPS
A lock (
) or https:// means you've safely
connected to the .gov website. Share sensitive
information only on official, secure websites.
Family income, family direct and indirect cost per patient/year due to severe asthma and family annual net income, before and after ProAR intervention (median ± quartiles). Reprinted with permission from Allergy.40.