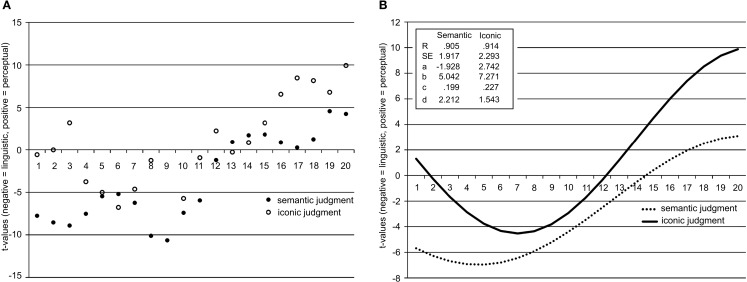
Figure 3.
(A) t-values for each of the 20 time bins for both the semantic judgment and iconicity judgment conditions. Negative t-values represent a relative bias toward linguistic cortical regions, positive t-values represent a relative bias toward perceptual cortical regions. (B) t-values for each of the 20 time bins for both the semantic judgment and iconicity judgment conditions fitted using a sinusoidal curve model and correlation coefficients, standard errors, and parameter coefficients for the sinusoidal model, y = a + b × cos (cx + d). Negative t-values represent a relative bias toward linguistic cortical regions, positive t-values represent a relative bias toward perceptual cortical regions.

