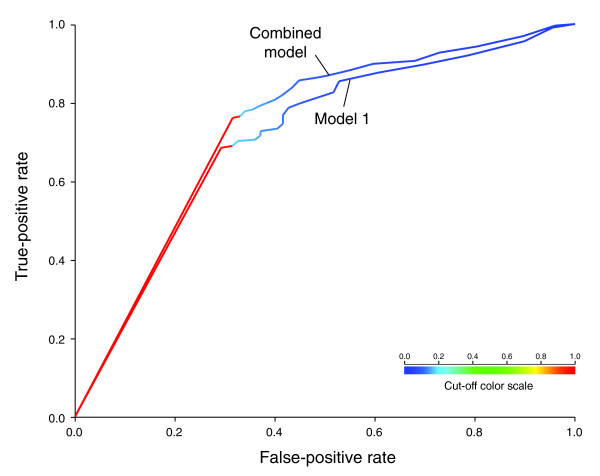
Figure 3.
Essentiality predictions in model I and in the combined model. Shown are receiver operating characteristic curves for the correctly predicted fraction of gene essentiality (y-axis) based on model 1 and the combined model when the essentiality threshold for the TraSH experiment [19] is allowed to vary between 0 and 0.2 in increments of 0.002 (x-axis).

