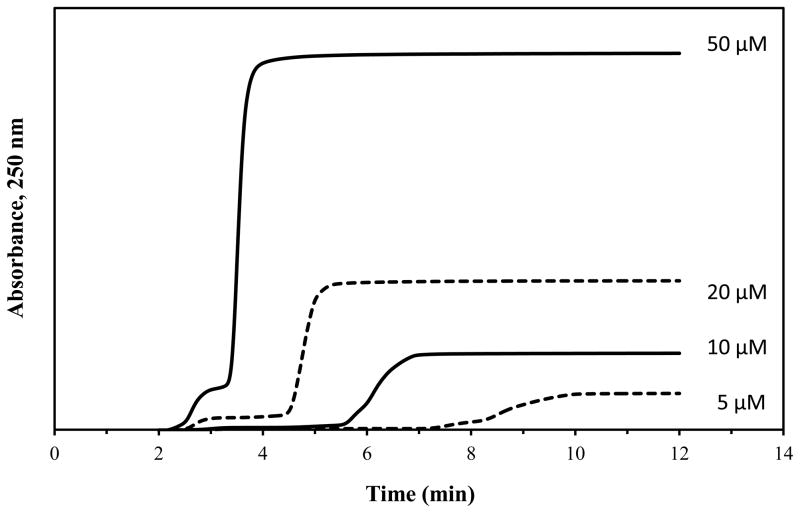
Figure 2.
Example of frontal analysis studies for glibenclamide on a normal HSA column at pH 7.4 and 37°C. These results were obtained at 0.5 mL/min and using glibenclamide concentrations of 50, 20, 10, and 5 μM (top-to-bottom). The small initial step changes shown to the left occurred at or near the column void time and probably represent only a small difference in composition and background absorbance of each drug solution versus the application buffer; these small step changes were not included in the data analysis and integration of the much larger frontal analysis curves that are shown to the right.

