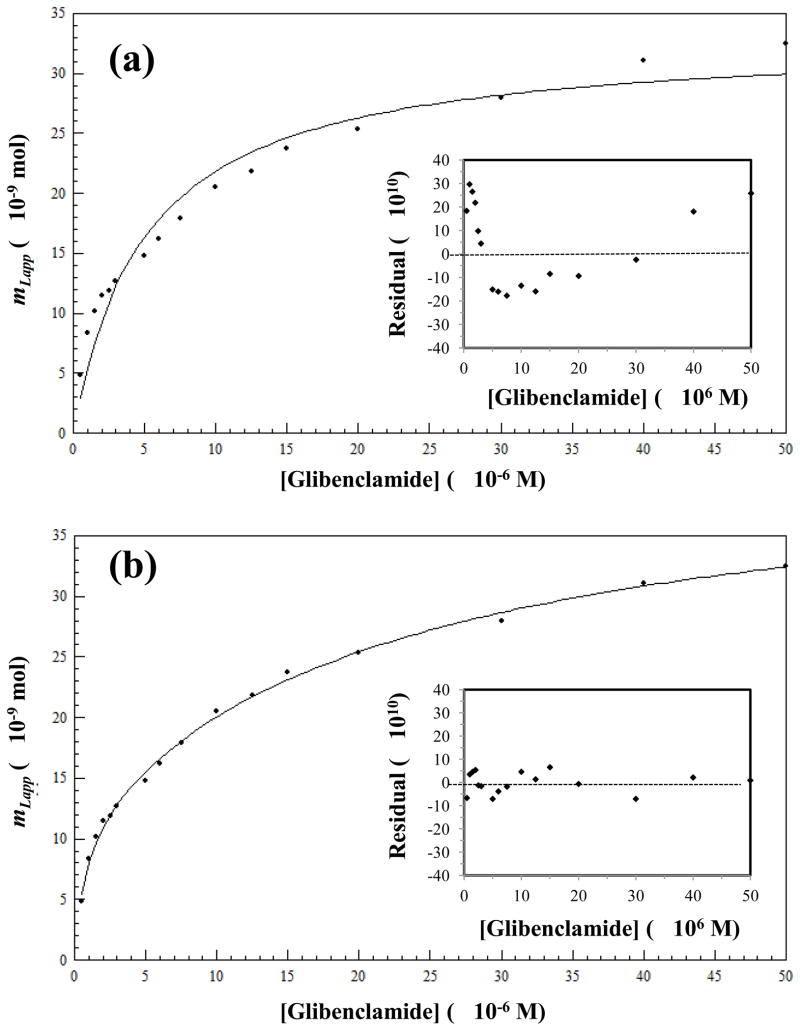
Figure 3.
Data obtained for glibenclamide on a normal HSA column as fit to (a) a one-site binding model generated by using Eq. (1) or (b) a two-site binding model generated by using Eq. (3). The insets in (a) and (b) show the corresponding residual plots. Each point represents the average of four runs, with typical relative standard deviations that ranged from ±0.02% to ±7.9% (average, ±1.9%).

