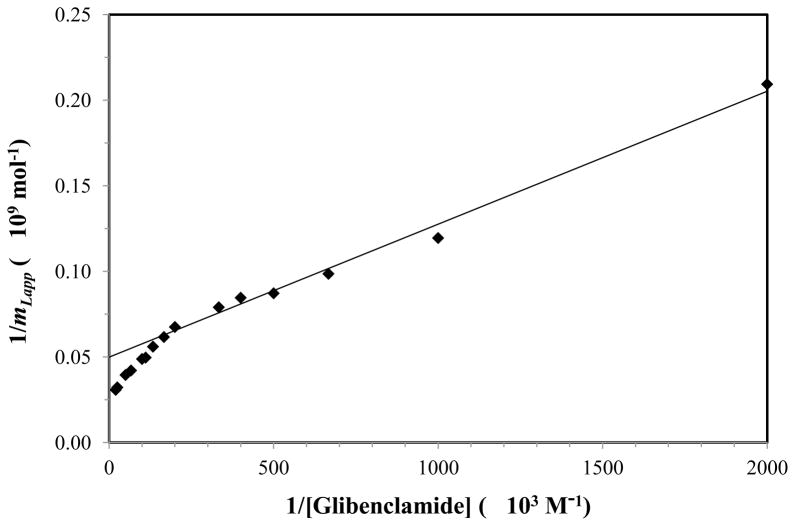
Figure 4.
A double-reciprocal plot for frontal analysis experiments that examined the binding of glibenclamide with normal HSA. The data in this plot were the same as utilized in Figure 3. The best-fit line was generated by using the data for 0.5–5 μM glibenclamide and gave a correlation coefficient of 0.996 (n = 7).

