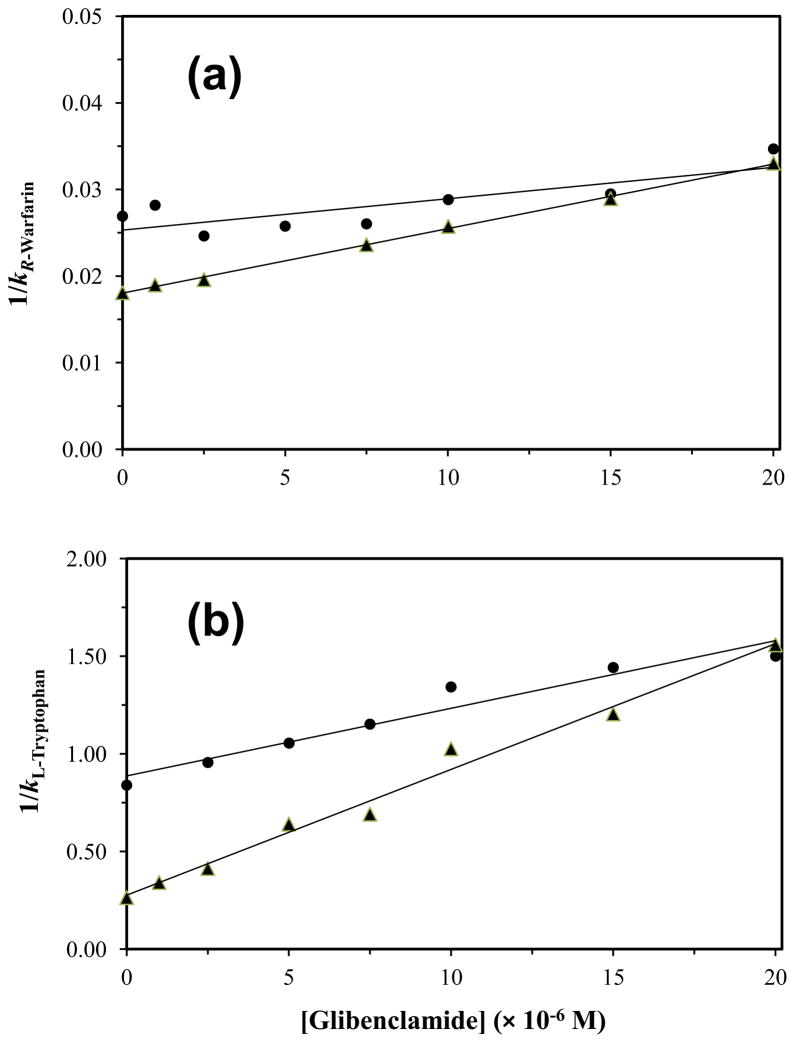
Figure 5.
Plots prepared according to Eq. (6) that show how the reciprocal of the retention factor for (a) R-warfarin or (b) L-tryptophan changed on normal HSA or glycated HSA columns as the concentration of glibenclamide was varied in the mobile phase. These results are for normal HSA (●) and gHSA2 (▲). Each point in these plots is the mean of four runs, with relative standard deviations in (a) that ranged from ±0.3% to ±2.6 (average, ±2.1%) and in (b) that ranged from ±2.2% to ±15.4 (average, ±7.1%). The correlation coefficients for the normal HSA and gHSA2 plots in (a) were 0.966 (n = 6) and 0.975 (n = 8), respectively, while the correlation coefficients in (b) were 0.970 (n = 7) and 0.993 (n = 8).

