


Figure 2.
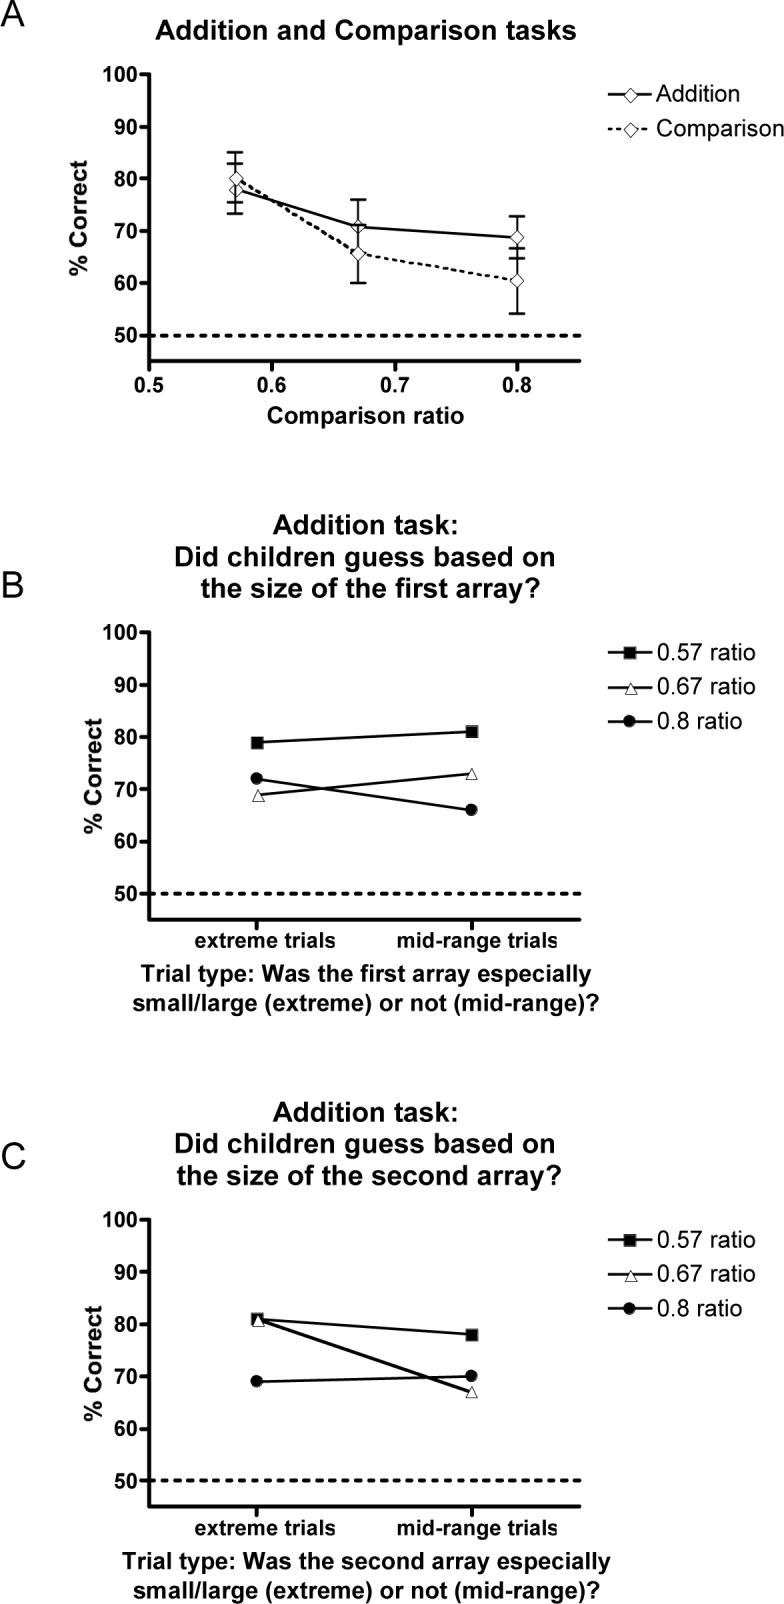
Accuracy data for the cross-modal addition task (Experiment 1) and matched comparison task (Experiment 2). Chance is 50% for all plots. A. Accuracy scores (mean and SEM) are plotted against the ratio of the numerosities to be compared. B. Accuracy at each comparison ratio for addition trials whose first array represented extreme numerical values (near the low end or the high end of the range of numerosities used) and for addition trials whose first array included only mid-range values. C. Accuracy at each comparison ratio for addition trials whose second array represented extreme numerical values (near the low end or the high end of the range of numerosities used) and for addition trials whose second array included only mid-range values.