Figure 1.

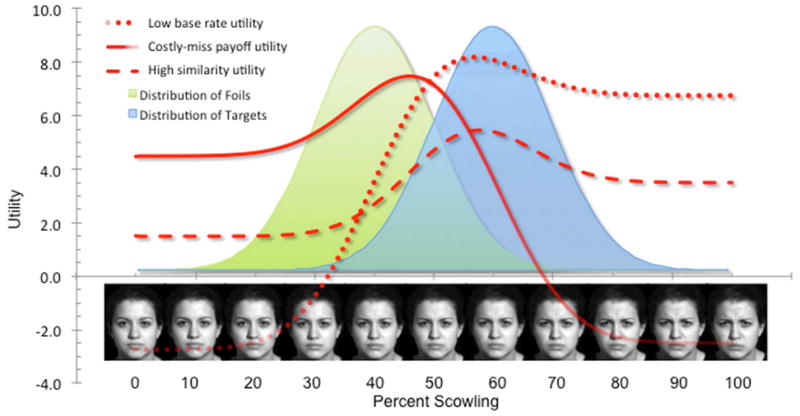
Threat perception as a signal detection issue. As input, the Signal Utility Estimator model uses experimenter-supplied signal parameters (e.g., mean and standard deviation of target and foil threat categories [comprising less <−> more scowling faces], modeled here by green and blue bell-shaped likelihood distributions that define the similarity parameter). The SUE output is the expected utility (red lines) of adopting a decision criterion at any given location on the range of faces. The point of maximum utility is the optimal decision criterion location for a given set of parameter values. Perceiving all faces right of criterion as “threat” will maximize utility (measured as points earned in our experiments). Different environmental conditions (sets of parameter values) have differently shaped utility functions. Some environments call for a liberal (leftward) criterion location, mildly scowling faces on the left of the continuum should be categorized as “more threatening” (thus incurring few missed detection mistakes but many false alarm mistakes). Other environments call for a conservative (rightward) criterion, in which perceivers should not respond to those same mildly scowling faces as “more threatening” (incurring more missed detections but fewer false alarms). For clarity, the y-axis for the signal distributions (Probability Density) and the distribution of foils for the low similarity condition are not shown.
