
Figure 1.
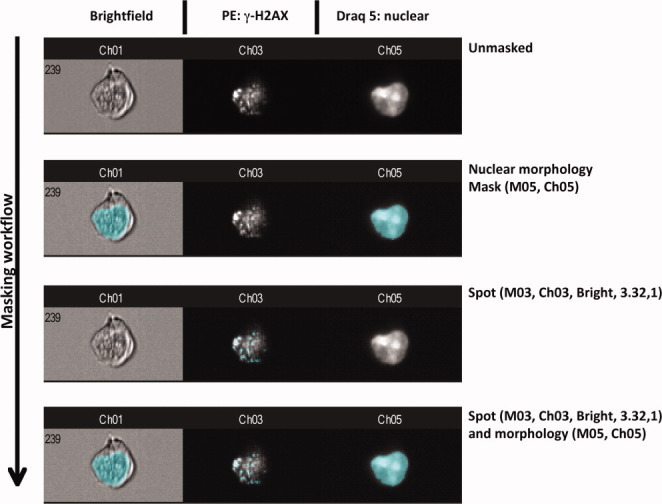
The strategy whereby nuclear γ-H2AX foci were identified, masked, and enumerated is shown. Here, an example of a cell in brightfield, channel 3 (γ-H2AX foci), and channel 5 (nuclear staining by Draq 5) is shown in an unmasked format. Next a nuclear morphology mark is applied after which a spot mask is applied to channel 3 showing γ-H2AX foci. Finally, spots (γ-H2AX foci) masking within the nuclear region is shown. The associated name path for foci calculation from the Ideas software is shown to the right of the images.