
Figure 2.
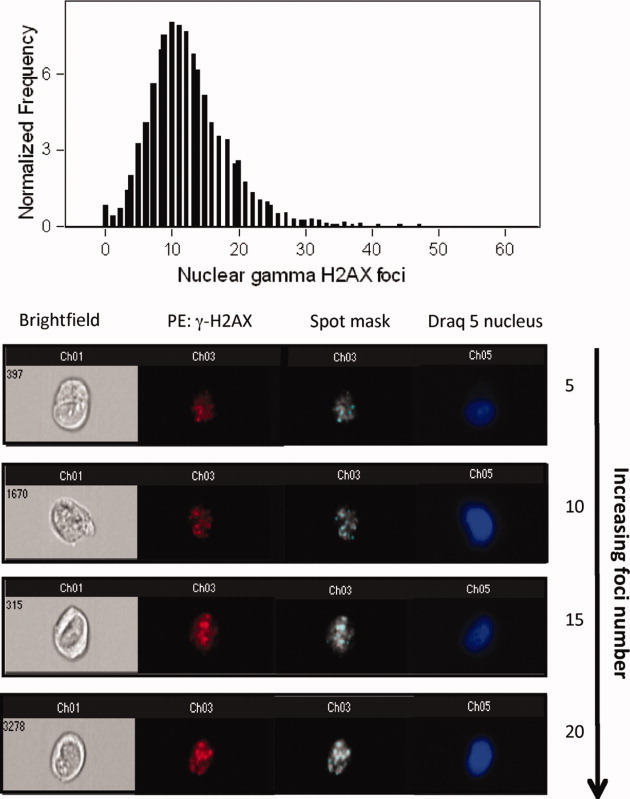
This figure shows a typical distribution plot of γ-H2AX foci in ∼ 20,000 cells following exposure to 2 Gy gamma radiation. Additionally, multispectral images of cells with increasing numbers of γ-H2AX foci within the nucleus are shown. Each panel depicts a brightfield image (channel 1) of the cell followed by an image of γ-H2AX foci within the nucleus with and without the spot mask. To visualize the spot mask, images have been presented in grayscale. Finally, an image of each cell stained with Draq 5 identifying the nucleus is shown.