
Figure 3.
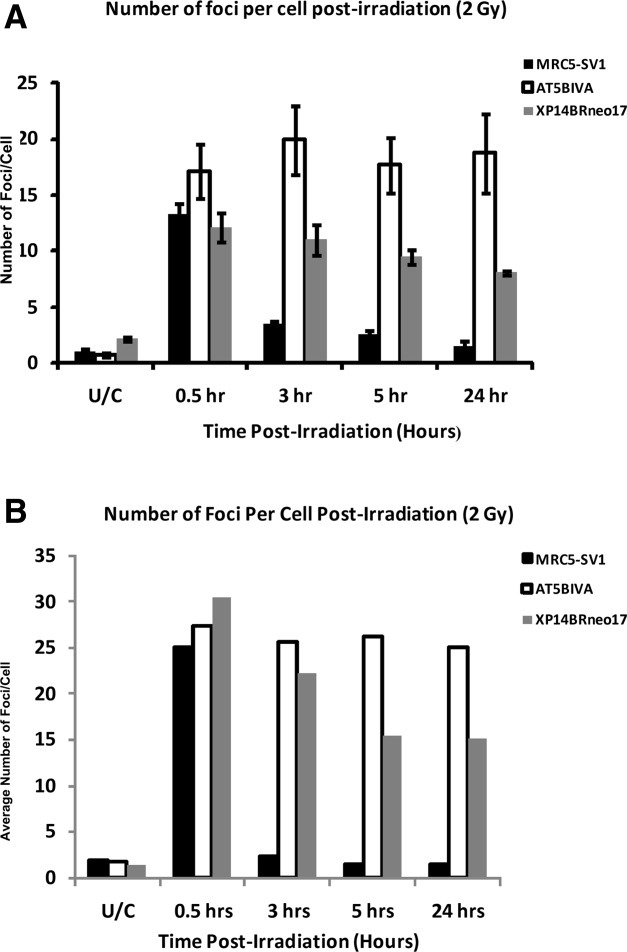
The mean number of γ-H2AX foci after analysis using the ImagestreamX in MRC5-SV1, AT5BIVA and XP14BRneo17 cells is shown in Figure 3A. Average foci numbers are shown in untreated control cells and at 30 min, 3, 5, and 24 hrs after exposure to 2 Gy gamma radiations. Error bars represent standard error of the mean derived from three independent experiments in which 20,000 cells at each time point were analyzed. Figure 3B shows a distribution analysis of γ-H2AX foci in the nuclei of the three cell lines in untreated cells and in cells at 30 min, 3, 5, and 24 hrs after exposure to 2 Gy gamma radiation using in situ microscopy. Data here are derived from counting at least 100 cells at each time point.