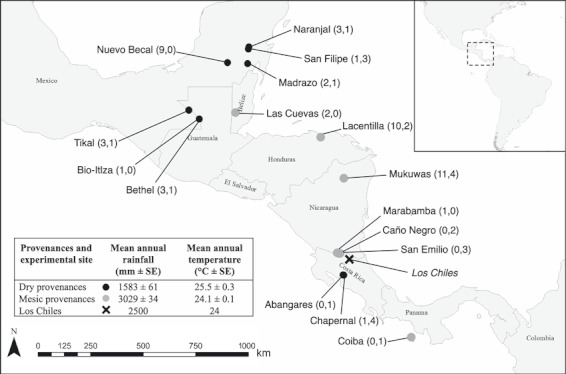
Figure 2.

Study area map showing common garden experiment location (×), sample population locations from mesic (grey filled circles) and dry (black filled circles) provenances. Provenance-context sample sizes shown in parentheses (forest and isolated trees). Inset Table shows mean (mm ± standard error) annual rainfall of provenance-context groups. Inset map shows location of study region, highlighting study area (box).
