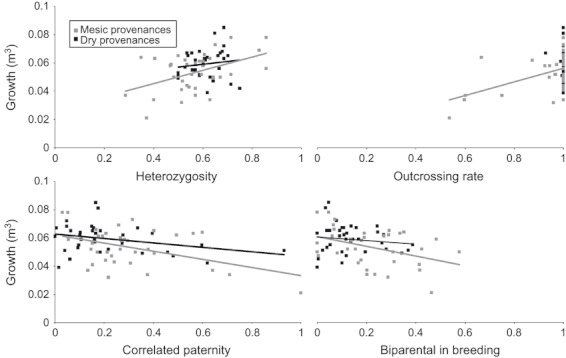
Figure 3.

Scatterplots showing relationships between family-level genetic parameters and growth for both provenances. Growth is shown on the y-axis and genetic parameter values are shown on the x-axis. Mesic provenance family data are indicated by grey-filled squares, dry provenance family data indicated by black-filled squares. Linear trend lines between genetic parameters and growth shown for relationships where ΔAICc < 4 (ΔAICc values presented in Table 2), with grey lines for mesic provenances and black lines for dry provenances.
