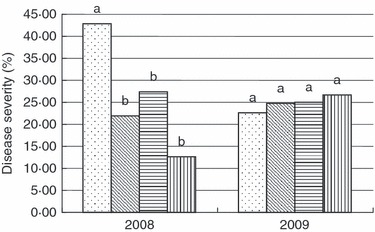
Figure 2.

Effects of disease control application on disease severity in chickpea field in 2008 and 2009. (P=0·003 and 0·719 in 2008 and 2009). Different low case letters indicates significantly different means, according to Wilks’ Lambda test (α= 0·05, n=16). ( ) Control; (
 ) Treatment I; (
 ) Treatment II and (
 ) Treatment III.
