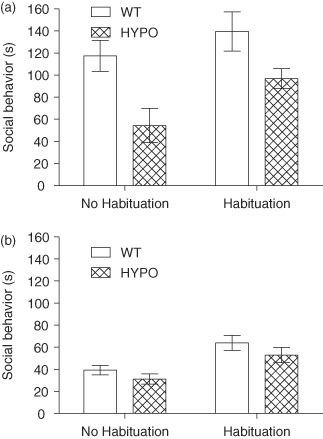
Figure 1. Time spent socially interacting for GluN1.

hypo(HYPO) and WT mice split into male (a) and female (b) mice. In the social interaction task, GluN1hypo mice show a deficit in social behavior that is driven by differences between male mice (a) and not female mice (b). This group difference was not diminished by habituation to the testing environment but did increase social activity in all mice. Time spent socially interacting is expressed as mean ± SEM.
