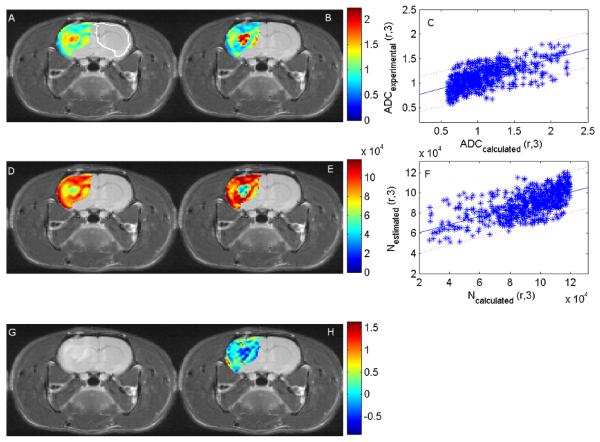
Figure 1.
The panels display an axial cross section through a rat brain with a tumor in the left hemisphere. Panels A and B are the experimental and the calculated ADC values (×10−3 mm2/s), respectively. The white outline in panel A was used to calculate the parameters for the contralateral tissue for comparison to the tumor values. Panel C compares these values with the 95% confidence interval indicated by the dotted lines. Similarly, panels D and E present the estimated and calculated number of cells at day 3, respectively, and Panel F compares these values with the 95% confidence interval indicated by the dotted lines. As in the case of the ADC values the Pearson’s correlation coefficient between the calculated and the estimated number of tumor cells is 0.65. Finally, panels G and H depict an anatomical T2 weighted image and the proliferation map calculated from ADC values on days 0 and 1. While the absolute values of the two methods do not quite match, there is general agreement in distribution between the estimated and calculated number of cells at day 3 and between the experimental and the calculated ADC values at day 3.

