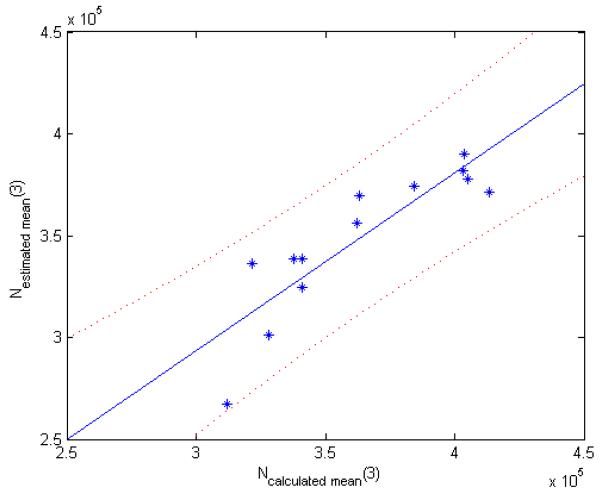
Figure 2.
The figure displays a graph of the ROI average NCakuiated_mean(3) versus Nestimated_mean(3) for each rat with the 95% confidence interval displayed as dotted curves. Each point in the image represents one animal. There is a strong correlation between the mean estimated and the mean calculated number of cells in day 3 with a Pearson’s correlation coefficient of 0.88 (p = 0.0001) with a 95% confidence interval of (0.63, 0.96) for all the rats. The concordance correlation coefficient between Ncalculated_mean(3) and Nexperimental_mean(3) for all rats is 0.80 with a 95% confidence interval of (0.49, 0.93).

