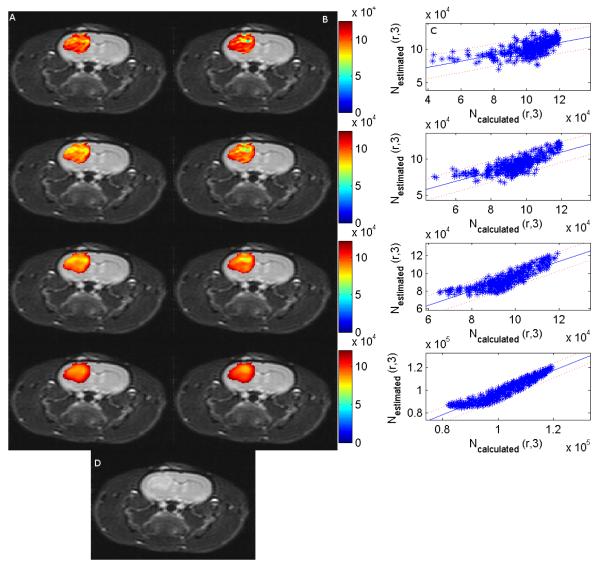
Figure 3.
Columns A and B display an axial cross section through a rat brain with the experimentally determined number of cells at day 3 and the calculated number of cells at day 3, respectively. Column C is the corresponding plot of the calculated and the experimental number of cells at day 3 with the 95% confidence interval displayed. Panel D is the T2 weighted image at time 3.The different rows correspond to different degrees of smoothing with row 1 corresponding to the original image with no smoothing with a Pearson’s correlation of 0.61 between the experimental and the calculated number of cell at day 3; row 2 correspond to a convolution with a 2×2 averaging filter (r = 0.76); row 3 corresponds to a convolution with an 4×4 averaging filter (r = 0.86); and the last row corresponds to a convolution with an 8×8 averaging filter (r = 0.95). As the filter width increases, the correlation between the experimental and the calculated number of cells at day 3 increases which indicates that the weak correlation between the experimental and the calculated number of cells without filtering may be due to the relatively low SNR at which the images were acquired. However, as the smoothing increases, the fine details of the tumor are lost.

