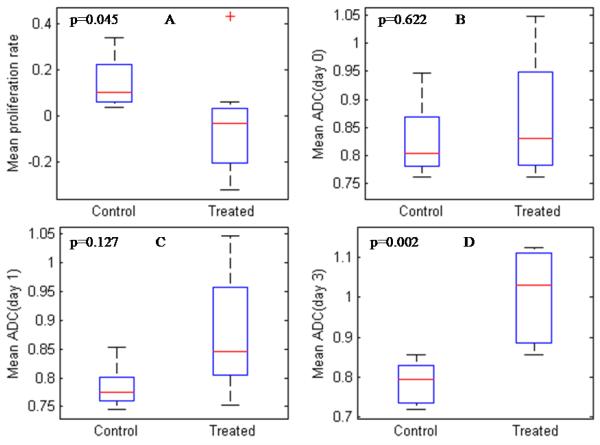
Figure 4.
Panel A is a box plot of the mean proliferation rate estimated from days 0 and 1, while panels B, C and D are box plots of the mean ADC from days 0, 1 and 3, respectively. The mean proliferation rate can be used to separate the treated and the control animals (obtained from days 0 and 1; panel A) while the mean ADC cannot separate the treated and the control animals until day 3 (panel D).

