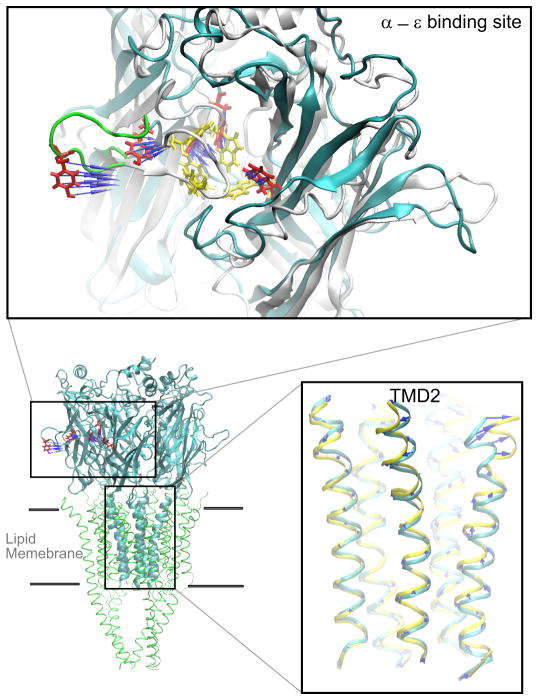
FIGURE 13.
Steered MD simulation of human AChR homology model beginning with the apo conformation (aromatic residues in red), using PDB code 2BG9 as a template, and ending with the agonist bound conformation (aromatic residues in yellow), using PDB code 1UV6 as a template. Arrows indicate direction of force application. Large inset shows TMD2s before (blue) and after (yellow) simulation. [From Wang et al. (280).]

