Figure 5.

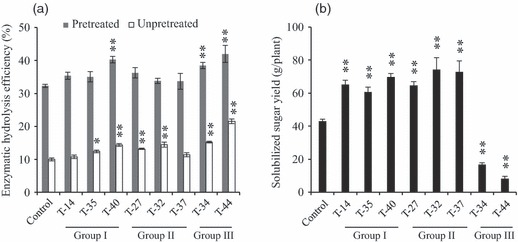
Saccharification efficiency (a) and solubilized sugar yield (b) of transgenic switchgrass plants. Values are means ± SE (n = 3). One or two asterisks indicate significance corresponding to P < 0.05 or 0.01 (one way ANOVA, Dunnett’s test).

Saccharification efficiency (a) and solubilized sugar yield (b) of transgenic switchgrass plants. Values are means ± SE (n = 3). One or two asterisks indicate significance corresponding to P < 0.05 or 0.01 (one way ANOVA, Dunnett’s test).