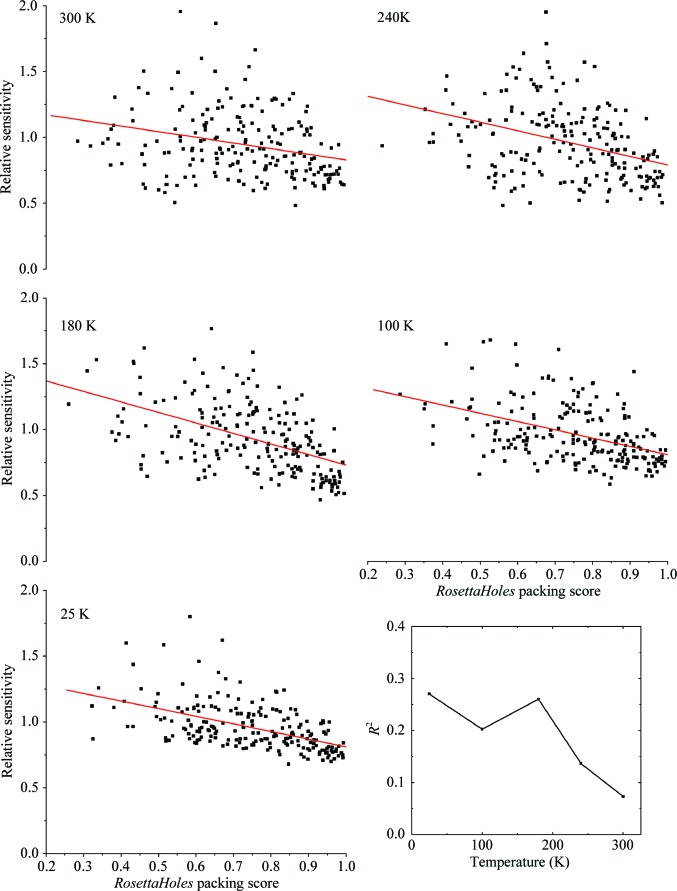
Figure 6.
Relative sensitivity of each residue in thaumatin crystals versus the packing score for each residue from RosettaHoles. The solid lines show the result of a linear regression analysis, and R 2 for the analysis at each temperature is shown in the inset at the lower right. At T = 25, 100 and 180 K approximately 25% of the variability in sensitivity can be explained by differences in local packing. The correlation diminishes at 240 and 300 K, presumably because other effects become more important.

