
. 2009 Dec 11;4(3-4):375–392. doi: 10.1080/19320240903321292
Copyright © Taylor & Francis Group, LLC
This is an open access article distributed under the Supplemental Terms and Conditions for iOpenAccess articles published in Taylor & Francis journals, which permits unrestricted use, distribution, and reproduction in any medium, provided the original work is properly cited.
FIGURE 6.
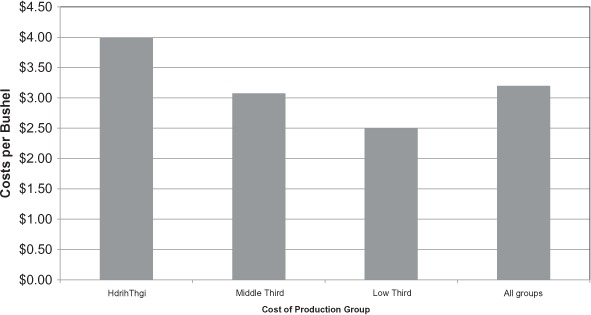
Corn total economic cost per bushel by cost group.12