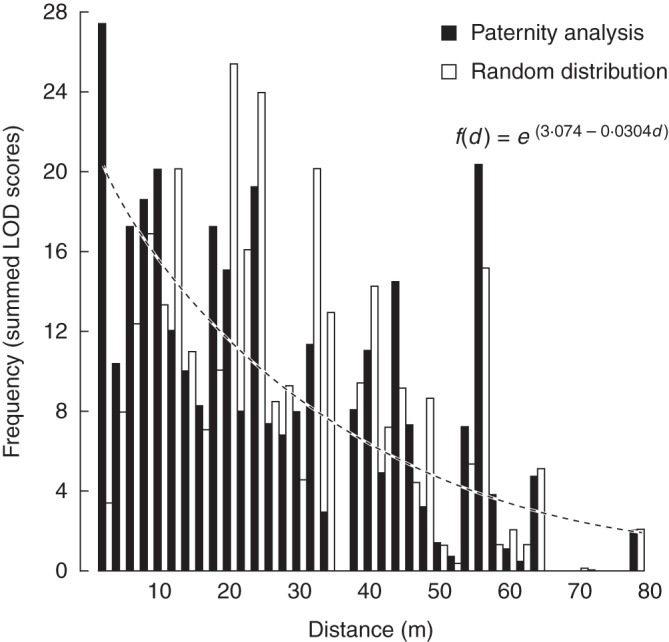
Fig. 2.

Histogram of pollination frequencies in Campanula thyrsoides from the paternity analysis based on relative LOD scores to potential fathers of 331 offspring and from a distribution based on random mating of fathers from 110 assigned offspring (as indicated) in distance classes of 2 m. The dashed line indicates the model fit through the paternity analysis data using an optimized negative exponential model (Pluess et al., 2009).
