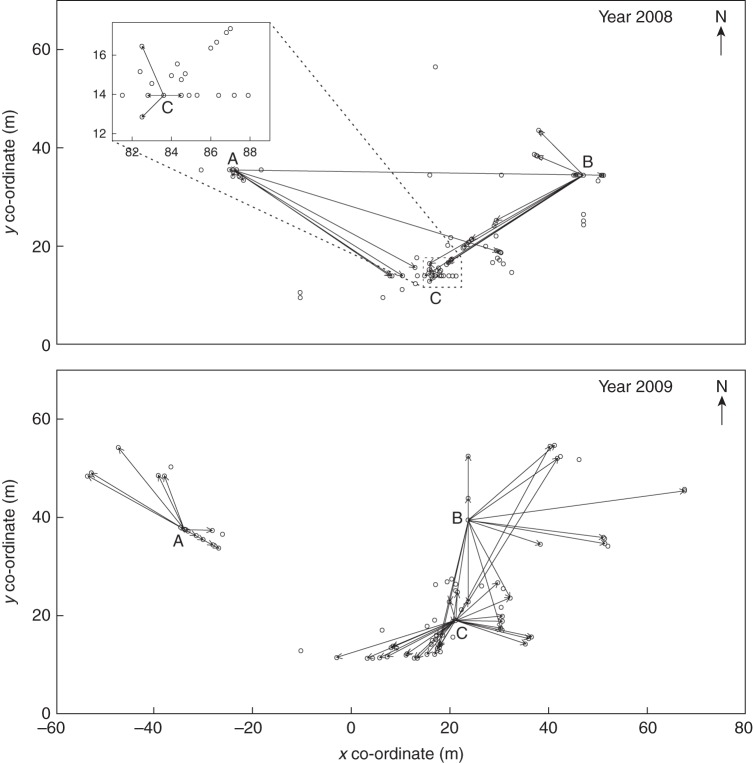
Fig. 4.
Maps showing the pollinations of Campanula thyrsoides within the study population no. 19 on Schynige Platte as observed using pollen analogues applied to three flowering individuals (A, B and C) each in 2008 (top) and 2009 (bottom). The co-ordinates of both maps are similar (also to Fig. 3).

