
Fig. 5.
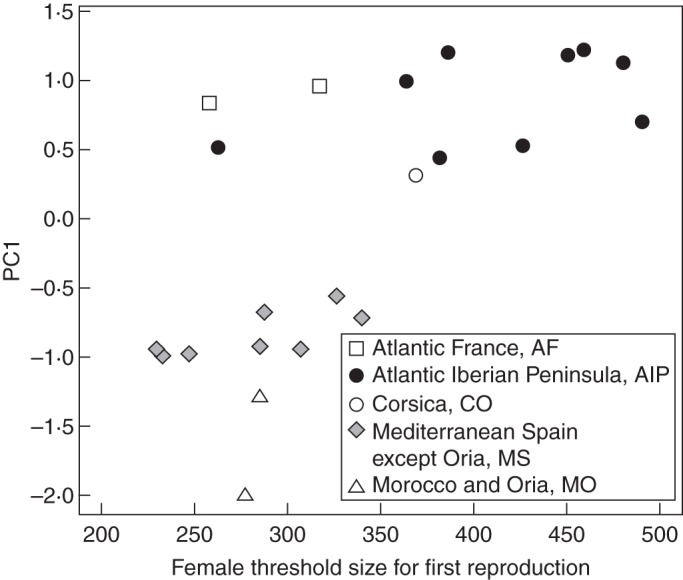
Variation of Pinus pinaster median female threshold size for first reproduction along an environmental harshness gradient, as estimated by population scorings on PC1. Symbols represent genetic groups, as indicated in the key.
Official websites use .gov
A
.gov website belongs to an official
government organization in the United States.
Secure .gov websites use HTTPS
A lock (
) or https:// means you've safely
connected to the .gov website. Share sensitive
information only on official, secure websites.
Variation of Pinus pinaster median female threshold size for first reproduction along an environmental harshness gradient, as estimated by population scorings on PC1. Symbols represent genetic groups, as indicated in the key.