Figure 1.

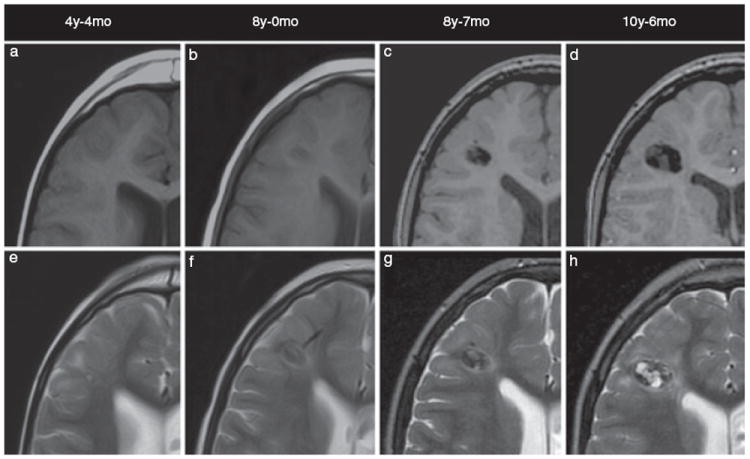
Axial T1 SE (a, b), 3D SPGR (c, d), and T2 FSE (e–h) magnetic resonance imaging shows progression in the size and appearance of the right frontal cortical tuber over time. Images are presented chronologically.

Axial T1 SE (a, b), 3D SPGR (c, d), and T2 FSE (e–h) magnetic resonance imaging shows progression in the size and appearance of the right frontal cortical tuber over time. Images are presented chronologically.