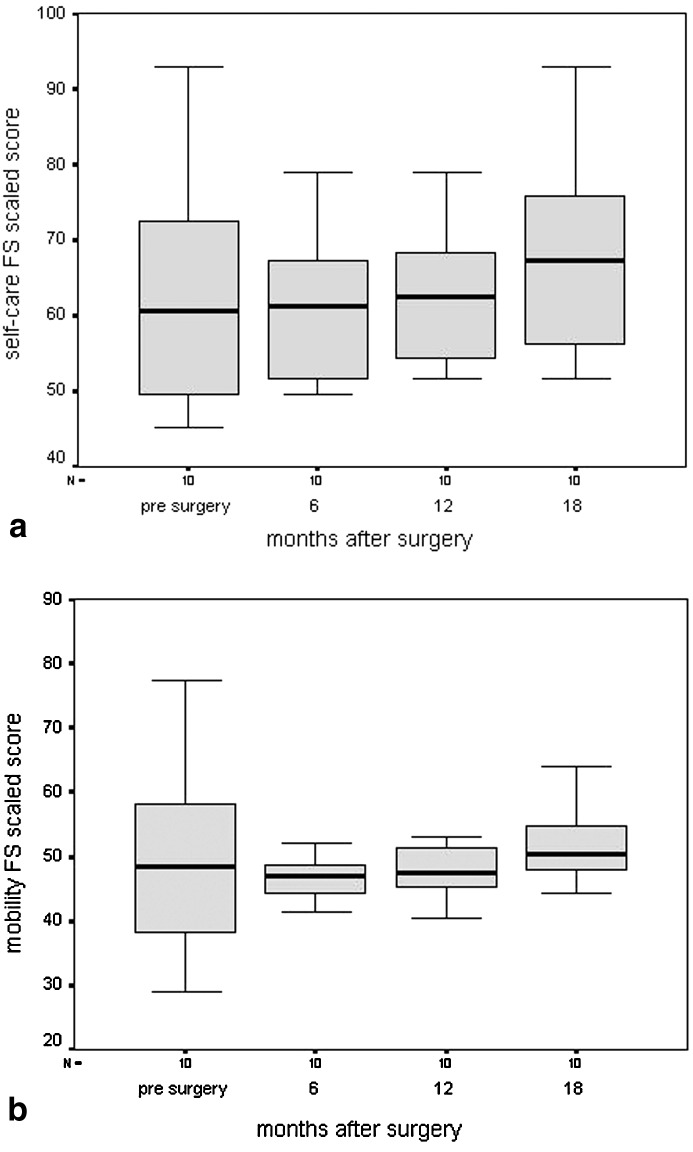
Fig. 1.
Box plots of functional-skills scaled scores with regard to a self-care and b mobility during the four assessments. The whiskers represent the highest and lowest values within 1.5 times the interquartile range (box length, IQR). The lower horizontal line of the box indicates the 25th percentile. The upper horizontal line indicates the 75th percentile. The mid horizontal bar in the box indicates the median. (FS functional skills)

